What I learned about Social Analytics working with the WE Charity.
Since last spring, I've had the very good fortune of working with the WE Charity. Some of you may have known them as Free the Children, and many of your kids may attend WE Days and wear a ME to WE rafiki bracelet. They are a fantastic organization with global reach, engaging many generations from many cultures.
When I was introduced to WE, they had a vibrant social media team who, like most social teams, were running like wildfire to keep up. With a slew of content coming from every direction, they published and pivoted like champions. But as often occurs, when hustling quickly we often overlook data collection, analysis, and insight gathering to reflect on the work in-market.
That's when they hired me! Addressing the lack of resources internally, they looked for external partners who could dive in head-first and take the reigns on data analysis, reporting, insights, and strategic recommendations based on those insights.
The (Content) Heavy Holiday Campaign

During my time with WE, we ran a content-heavy Holiday campaign that had many different messaging streams. So many in fact, that we couldn't splice the data in all of the ways that we needed before we had an analytics tool, which meant we needed to decipher our data manually.
Here are the things that I learned during the manual data collection process, that I want to pass along to you:

Crunching data manually is immensely time consuming
No kidding, you knew that. But imagine a weekly report that includes three brands, each with three social channels. That's nine brand properties.
Each brand property has three key messaging streams. That's 27 individual messaging streams. It's okay, plug them into the template.
There's no template. That took another 20+ hours of work for a fully functioning reporting template.
Each week, we manually downloaded the back-end data from Facebook and Twitter. Instagram does not have a back-end data download, so that is entered into an Excel sheet manually. Manually. Each post's Likes, Comments and Saves are entered manually into separate worksheets for three brand channels.
What did this teach me?
Think about the number of different messages your brand sends out. How many posts go out on any one channel in a week? Think critically about the volume. From there you can gauge what you ask of your team. It's wonderful to ask for it all, analyzed and wrapped in a bow, but there are limitations to the volume of data a person can manually collect before errors begin. Select your key messages to be measured strategically, and ensure they are clear calls-to-actions so you can measure results.
Segmentation is huge—understand your message and how it resonates
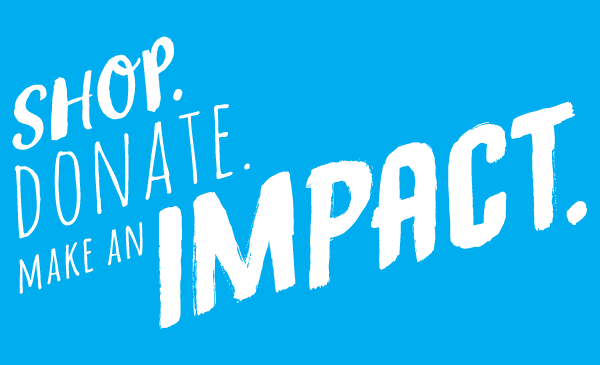
During our holiday campaign, we had three message streams: Shop, Donate, and Engage. Each post that went out was categorized into one of these three, and #hashtagged accordingly so they could be identified during the manual data pull.
This segmentation gave substantial insight into how different audience responded to each message, depending on the brand and social channel it was delivered through. By tracking each steam, we were able to identify how our audience differed and the type of message they expected, and thus engaged in, from the brand.
What did this teach me?
Leveraging this data allowed us to pivot when a message wasn't resonating from one of the three brands, and to better comprehend the purpose and CTA that fit best with each channel. From there, we can streamline the messaging to what resonates most, and increase engagement. Use your data to make your messaging better, and align with what your audience expects from your brand.
The tool ultimately costs less than the person
As I went through the manual data pull process, report creation, correction, review, and presentation, the other thing that came glaringly clear to me was that the tool has a lower cost than the data analyst.
With proper enterprise analytics software, you're looking at an annual spend of anywhere between $75k-$150k depending on the size of your organization and vendor. Between an analyst's salary and overhead alone, you're looking at up to half of the software cost already. From there we look at opportunity costs: Time for template creation and Excel programming approved by senior teams, coordination with the Community Managers to cross-check all content against their hashtags, revisions, senior review, more revisions.
What did this teach me?
The time invested to create a report from scratch spans across your entire team. With the tool however, you recuperate hundreds (in this instance) of hours by automating the process. Not only does software save a huge number of time, it dramatically decreases stress levels.
The Takeaway: Software that allows your to tag content will save your sanity and your money
Although the dollar figures on the contract will look intimidating, they are absolutely worth the investment. Not only in time and money, but in team burn-out as you are investing in tools that make their lives vastly easier.
Not only does it improve your team's quality of life, but it improves the quality of data you receive to inform you on how to run your organization. With exponentially fewer errors, automation, and custom report templates, you get the data you need consistently, whenever you need it.
If you or anyone you know are looking for a social media publishing and analysis tool, please feel free to engage me in reviewing their options, functionality, pricing, and implementation. It's my pleasure to stand by great resources.